Seq vs Grafana Loki vs Azure Application Insights in .NET: Which Log Aggregation Platform Should Your Team Use in 2026?
An enterprise-focused comparison for .NET teams in 2026
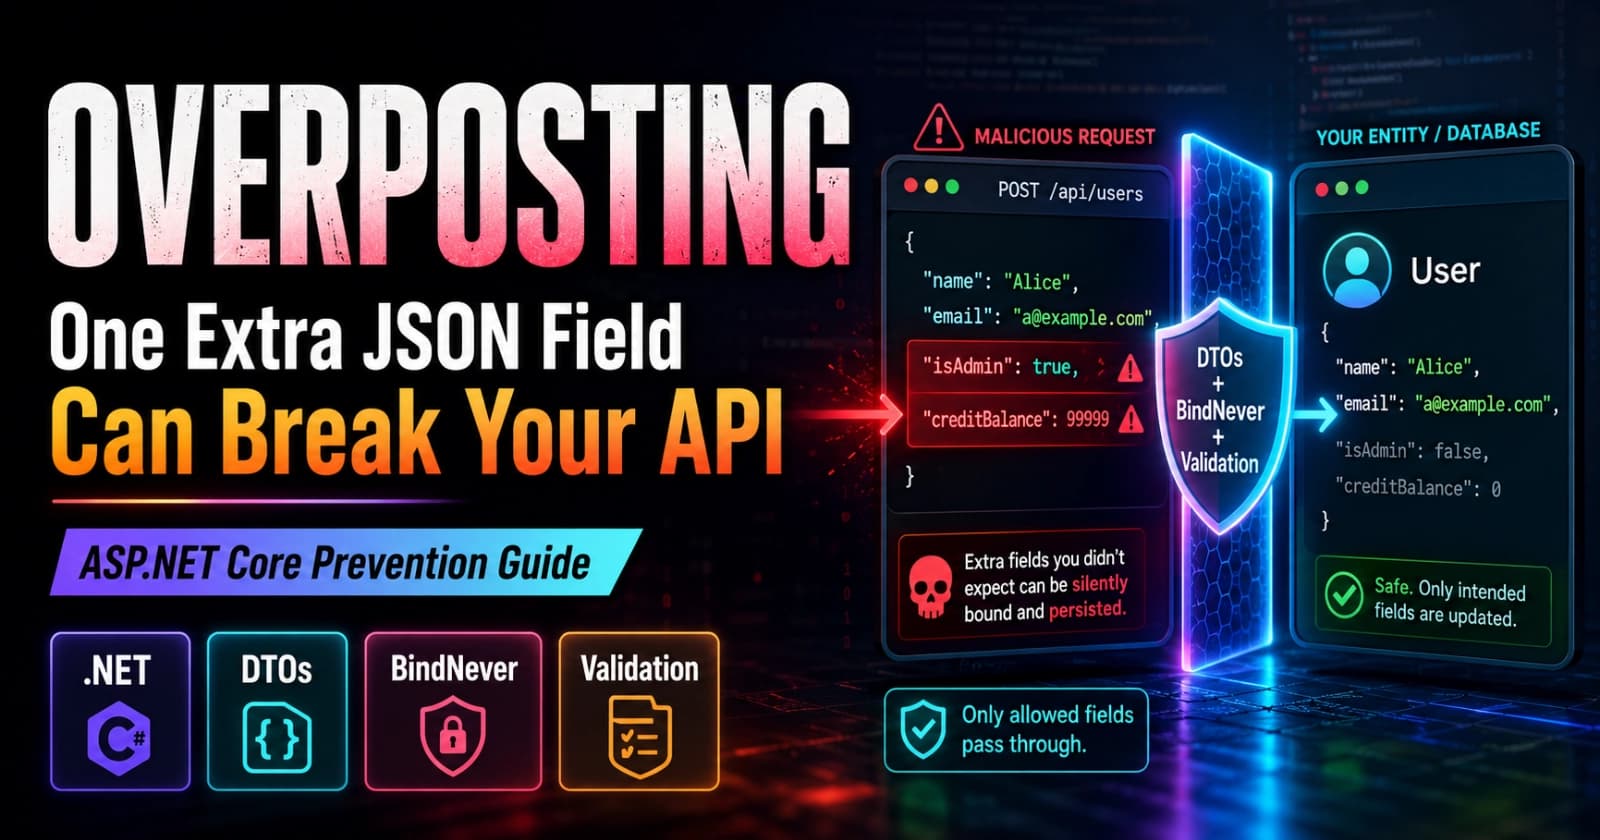
Choosing a log aggregation platform is one of those decisions that feels minor until it isn't. The wrong choice surfaces at 2 AM when you need to trace a production failure across fifty microservices and your query times out. The right choice is invisible — logs appear, queries run, alerts fire, and engineers sleep.
For .NET teams in 2026, the three platforms that dominate real-world conversations are Seq, Grafana Loki, and Azure Application Insights. All three integrate cleanly with Serilog and Microsoft.Extensions.Logging. All three support structured log ingestion. But they are built on fundamentally different assumptions about who you are, how you work, and what you're willing to trade. If you want to understand how these platforms fit into a complete production API, the Zero to Production course walks through observability end-to-end — from structured logging setup through health checks and OpenTelemetry — inside a real ASP.NET Core codebase.
This comparison is not about which tool is "best." It's about which tool is right for your team's constraints, your infrastructure posture, and the failure scenarios you need to diagnose fast. The full implementation patterns for each — including Serilog sink configuration, enrichment pipelines, and correlation ID forwarding — are available on Patreon, with annotated, production-ready source that maps directly to what enterprise teams actually ship.
What Each Platform Actually Is
Before comparing features, it's worth understanding the design philosophy behind each option. These are not interchangeable tools with different UIs.
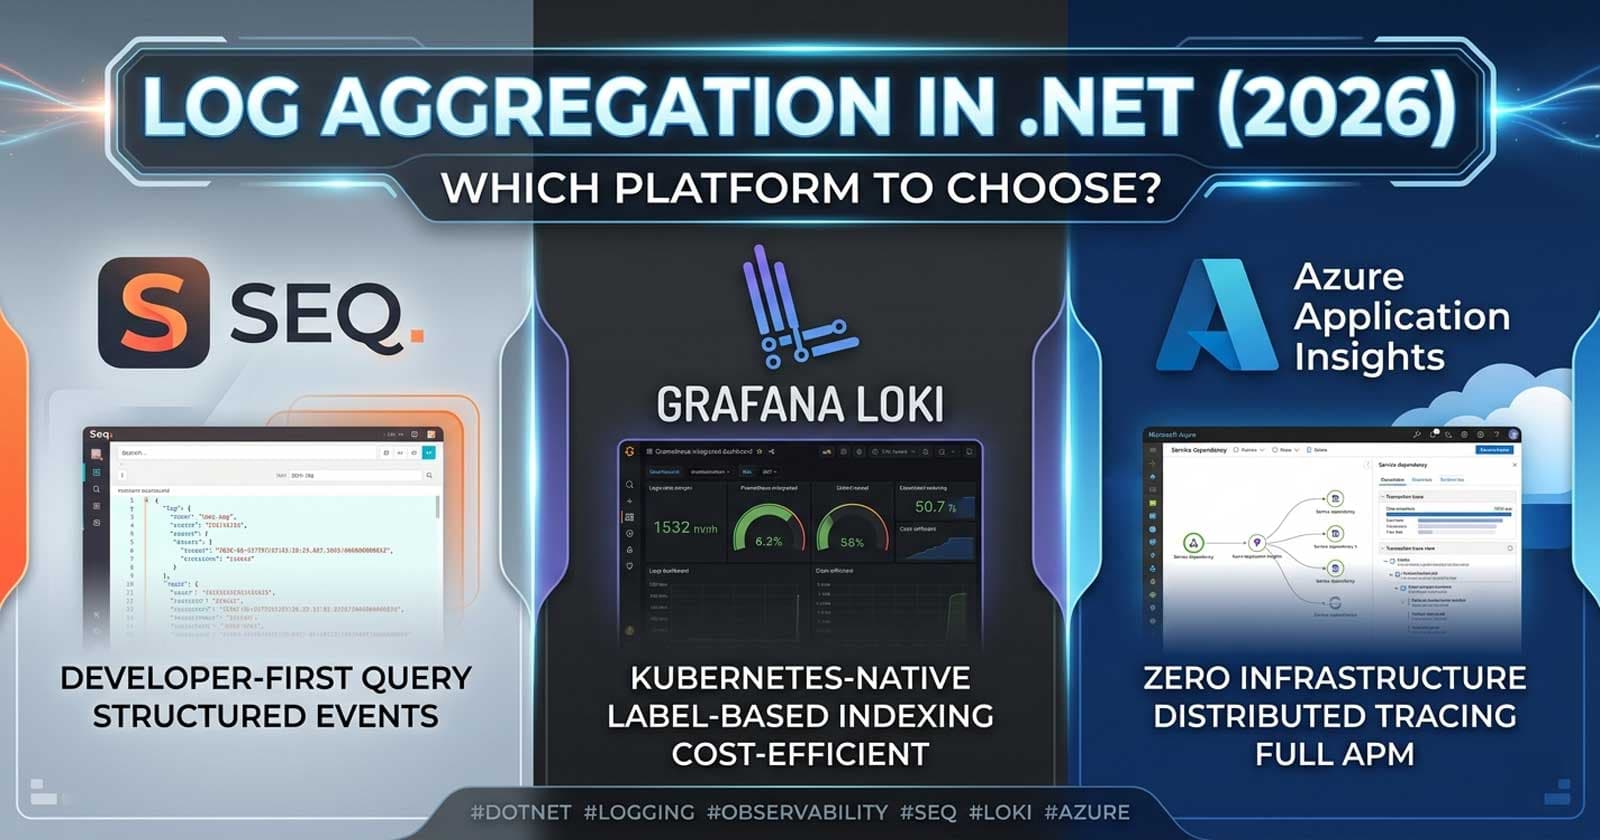
Seq is a purpose-built structured log server for .NET teams. It was designed from the ground up around the assumption that your logs are structured events — not text strings — and that developers are the primary audience. Seq speaks the same language as Serilog: it natively understands the {Property} template syntax, stores events as JSON documents, and provides a query language (seq.filter) that feels natural to .NET developers. It runs as a single Docker container or Windows service. Licensing is free for a single user, paid for teams.
Grafana Loki is a horizontally scalable log aggregation system built by Grafana Labs, designed to complement Prometheus. Its defining characteristic is that it does not index log content — only metadata labels. This makes it extremely cheap to store high-volume logs but comes with a significant trade-off: full-text search is expensive, and rich structured queries require pulling and parsing log lines at query time. Loki is cloud-native, Kubernetes-friendly, and pairs naturally with Grafana dashboards and Prometheus metrics.
Azure Application Insights is Microsoft's managed APM (Application Performance Monitoring) platform, part of Azure Monitor. It's not a pure log aggregator — it's a full telemetry platform that combines logs, distributed traces, performance metrics, dependency tracking, exception reporting, and user behaviour analytics in one service. It integrates tightly with the Azure ecosystem, requires zero infrastructure management, and offers features no self-hosted tool matches out of the box: end-to-end distributed trace views, automatic anomaly detection, and smart alerts.
How Each Platform Integrates With ASP.NET Core
All three integrate with Microsoft.Extensions.Logging and Serilog, but the depth and mechanics differ.
Seq integrates via Serilog.Sinks.Seq or Seq.Extensions.Logging. You point the sink at your Seq server URL, and structured events arrive with full property fidelity — every named placeholder in your log templates becomes a searchable, filterable field in Seq's UI. Correlation IDs, trace IDs, and custom enrichers flow through without configuration. Seq's .NET-first design means you don't have to adapt your logging model to the platform.
Grafana Loki integrates via Serilog.Sinks.Grafana.Loki (community sink) or through stdout piped into Promtail or the OpenTelemetry Collector. The label-based model means you attach metadata (environment, service, version) as labels at the sink level. Log content is stored as compressed chunks. Querying uses LogQL, which is powerful for label-based filtering but requires parsing log lines for structured property queries. Teams already running Prometheus and Grafana will find the operational model familiar.
Application Insights integrates via Microsoft.ApplicationInsights.AspNetCore or the OpenTelemetry exporter (Azure Monitor OpenTelemetry Distro). The ILogger integration is seamless — every log event, exception, dependency call, and HTTP request is automatically captured and correlated. Custom properties are added via TelemetryContext or ILogger structured parameters. No additional infrastructure required; telemetry flows to Azure Monitor in the background.
Is Seq Right for Your .NET Team?
Seq's sweet spot is the team that lives in structured logs and wants a developer-first query experience without the operational overhead of running a distributed system.
Where Seq wins:
The query language is the clearest differentiator. Writing @Level = 'Error' and UserId = 12345 and Environment = 'production' in Seq is natural and fast. Properties are first-class — Seq indexes them and returns results in milliseconds on most datasets. The UI is clean, opinionated, and built for the way .NET developers actually debug: filtering by exception type, correlating by request ID, inspecting the full structured event payload.
Signal routing is another strength. Seq's alerting system can filter on structured properties and send notifications without a separate alerting layer. For smaller teams or development environments, this is enough.
The single-server deployment model is straightforward. A Docker image, a volume mount, and a licence key. There is no cluster to manage, no distributed consensus protocol to understand. For teams that don't want to become Kubernetes experts just to run logging infrastructure, Seq's simplicity is a genuine advantage.
Where Seq adds friction:
Scale is the constraint. Seq's architecture is not designed for multi-node horizontal scaling on the free or standard tiers. High-throughput systems generating millions of events per day will hit storage and ingestion limits faster than Loki. Teams building truly large-scale systems need to plan for this early.
Multi-tenancy and RBAC are limited in Seq unless you're on the enterprise tier. If your security posture requires strict team-level data isolation or read-only access by log level, Seq's model may not fit without significant configuration.
Is Grafana Loki Right for Your .NET Team?
Loki is designed for cloud-native, Kubernetes-native deployments where storage cost matters and the team is already invested in the Grafana observability stack.
Where Loki wins:
Storage economics are dramatically better than indexed alternatives at scale. Because Loki only indexes labels — not log content — storage costs can be 10x lower than Elasticsearch or Seq at high volumes. For systems generating terabytes of logs, this matters.
The Grafana integration is the other major advantage. If you're already using Grafana for Prometheus metrics dashboards, adding Loki means your engineers can correlate metric spikes with log events in a single pane of glass. This unified view is genuinely powerful for on-call debugging: you see latency spike at 14:32, switch to Loki, filter by the same time range and service label, and find the log events immediately.
Kubernetes-native operation is a natural fit. Promtail or the OpenTelemetry Collector handles log shipping from pod stdout without application changes. This is valuable for teams running mixed workloads where not all services use Serilog.
Where Loki adds friction:
LogQL is powerful but has a steep learning curve for .NET developers accustomed to structured property queries. Filtering by a structured property like UserId in Loki requires a log line parser (| json | UserId = "12345") — it's not indexed, so it's a full scan of the matched chunks. For debugging individual user flows at scale, this is noticeably slower than Seq.
Operational complexity is real. Running Loki in production at scale means managing compactors, queriers, distributors, and ingester replicas. The Grafana Cloud managed tier solves this but moves you from self-hosted to SaaS with associated data residency considerations.
Is Azure Application Insights Right for Your .NET Team?
Application Insights occupies a different category. It is not just a log aggregator — it is a full APM platform with distributed tracing, dependency maps, user analytics, and managed infrastructure. The question is whether that breadth is an asset or a distraction for your team.
Where Application Insights wins:
Zero infrastructure is the clearest advantage. No servers to manage, no storage to provision, no upgrades to plan. Telemetry simply arrives in Azure Monitor. For teams where infrastructure is owned by a separate platform team, or for organisations using Azure as the primary cloud, Application Insights removes the log aggregation problem entirely.
Distributed tracing is where Application Insights genuinely exceeds the alternatives. The Application Map visualises service dependencies and call chains automatically. End-to-end transaction search lets you trace a single request from the frontend through an API gateway, into multiple microservices, and down to individual database queries — with timing data for each hop. Seq and Loki both support OpenTelemetry traces, but the visualisation and automatic correlation in Application Insights is more mature.
Smart alerting and anomaly detection are genuinely useful features you don't have to build. Application Insights can alert on unusual exception rate increases, latency regressions, and failed dependency patterns without hand-crafted alert rules.
Where Application Insights adds friction:
Cost at scale can become material. Application Insights pricing is based on data ingested. High-volume systems with verbose logging will find this adds up quickly. The Adaptive Sampling feature reduces ingested volume but means you lose some events — which is acceptable for performance metrics but problematic if you need guaranteed complete log retention for compliance.
Data residency and sovereignty are considerations for regulated industries. Telemetry leaves your infrastructure and is stored in Microsoft's Azure datacentres. For organisations in heavily regulated sectors — banking, healthcare, government — this is a blocker or requires careful data classification.
The lock-in profile is higher. Application Insights is not a standard — it's a Microsoft-proprietary platform. Migrating away requires rethinking both the telemetry pipeline and all your dashboards and alerts.
Side-by-Side Comparison: What Matters to .NET Teams
| Dimension | Seq | Grafana Loki | Application Insights |
|---|---|---|---|
| Structured query model | First-class, indexed properties | Label-indexed; content scan for properties | First-class, KQL-based |
| Infrastructure | Self-hosted (single node) | Self-hosted or Grafana Cloud | Fully managed (Azure) |
| Scale ceiling | Medium (single node) | Very high (distributed) | Very high (managed) |
| Distributed tracing | Via OpenTelemetry + Seq traces | Via Tempo + Grafana | Native, first-class |
| Developer experience (.NET) | Excellent — built for .NET | Good — requires LogQL learning curve | Good — tight Azure integration |
| Cost model | Licence-based (free for 1 user) | Storage-cost-efficient | Usage-based (can be expensive at scale) |
| Data residency | Your infrastructure | Your infrastructure or Grafana Cloud | Azure datacentres |
| Alerting | Built-in (signal-based) | Grafana Alerting | Azure Monitor Alerts |
| Kubernetes-native | Requires configuration | Native fit | Via Azure Monitor Container Insights |
| Vendor lock-in | Low | Low | High (Microsoft ecosystem) |
Which Should Your .NET Team Use?
There is no universal answer, but the decision tree is relatively clear once you define your constraints.
Choose Seq when: Your team is primarily .NET, you want the fastest developer-to-production debugging experience, you have modest log volumes or are willing to manage storage, and you want self-hosted control without distributed system complexity. Seq is the tool that .NET developers reach for when they have freedom to choose — it speaks the same language as Serilog and produces zero friction between writing a structured log event and querying it.
Choose Grafana Loki when: You're running on Kubernetes, you're already using Prometheus and Grafana for metrics, and storage cost at scale is a real constraint. Loki's label model is a trade-off, not a weakness — it's the right trade-off when you have high log volume, existing Grafana investment, and engineers comfortable with LogQL.
Choose Application Insights when: You're Azure-native, infrastructure management is not your team's responsibility, you need distributed tracing with zero configuration, and the compliance profile of managed SaaS is acceptable. Application Insights earns its place in teams that want to focus on the application, not the observability stack.
The tools are not mutually exclusive. Many production .NET teams run Seq for local and development environments, Loki in staging/production for cost efficiency, and Application Insights for distributed trace correlation in complex microservice architectures. The Serilog sink model makes running multiple outputs with different routing rules straightforward.
☕ Prefer a one-time tip? Buy us a coffee — every bit helps keep the content coming!
FAQ
Can I use Seq, Loki, and Application Insights together in the same ASP.NET Core application?
Yes. Serilog supports multiple sinks simultaneously. A common production pattern is routing Error and above to Application Insights for alerting, all structured events to Seq for developer querying during incidents, and high-volume diagnostic logs to Loki for cost-efficient long-term retention. Each sink can be configured with independent minimum level filters.
Does Grafana Loki support structured log properties from Serilog?
Loki stores log lines as text, not indexed structured properties. To query a property like UserId from a Serilog structured event, you use LogQL's | json or | logfmt parser to extract fields at query time. This works but is slower than Seq's indexed approach and requires familiarity with LogQL. The Serilog Loki sink serialises properties as JSON in the log body by default.
Is Application Insights compatible with OpenTelemetry in .NET 2026?
Yes. Microsoft's recommended path in 2026 is the Azure Monitor OpenTelemetry Distro, which exports OTLP telemetry to Azure Monitor. This means your instrumentation code is OpenTelemetry-standard, reducing vendor lock-in while retaining Application Insights' backend features. Direct SDK usage is still supported but OpenTelemetry is the forward-looking approach.
What is the right minimum log level to send to each platform?
A common enterprise pattern: send Debug and Information to Seq (developer-facing, high signal-to-noise), send Warning and above to Application Insights (alert-quality signals), and send all levels to Loki (long-term retention, auditing). This balances cost, query speed, and alert quality across all three platforms.
Does Seq support high-availability clustering?
Seq's standard edition runs as a single node. High availability requires architectural patterns at the infrastructure level — running multiple Seq instances behind a load balancer with shared storage, or using a different platform for HA requirements. For teams with strict HA requirements, Grafana Loki's distributed mode or Application Insights (managed) are better fits.
How do correlation IDs work across all three platforms?
All three platforms can propagate and display correlation IDs. With OpenTelemetry, trace context (TraceId, SpanId) is automatically attached to log events and flows across service boundaries. Seq displays trace IDs as searchable properties. Loki uses them as label or parsed field values. Application Insights provides the richest trace correlation UI, linking log events to the full distributed trace timeline.
What compliance certifications does each platform hold?
Azure Application Insights (via Azure Monitor) holds a broad range of compliance certifications including SOC 1/2/3, ISO 27001, HIPAA BAA, PCI DSS, and FedRAMP. Seq and Grafana Loki are self-hosted tools — compliance is your responsibility as the operator, which is either an advantage (data never leaves your infrastructure) or a burden (you must implement the controls). Grafana Cloud holds SOC 2 Type II and ISO 27001 certifications.