OpenTelemetry in ASP.NET Core: A Complete Guide for .NET Developers (2026)
Traces, Metrics, Logs, Exporters and Instrumentation — Everything a .NET developer needs to understand and implement OpenTelemetry in ASP.NET Core.
Modern distributed systems have transformed the way we build software - but they've also made debugging exponentially harder. When a single user request touches five microservices, three message queues, and two databases, a stack trace alone won't tell you what went wrong or where. Observability is the discipline of understanding what your system is doing from the outside, using the data it emits. And in the .NET ecosystem today, OpenTelemetry in ASP.NET Core has become the de facto standard for collecting that data in a consistent, vendor-neutral way. Whether you're running on Azure, AWS, GCP, or a bare-metal server, OpenTelemetry gives you a unified way to capture traces, metrics, and logs - without locking yourself into any single vendor's SDK.
Observability only helps if it is wired consistently end to end. The full setup is on Patreon. Chapter 14 of the ASP.NET Core Web API: Zero to Production course builds OpenTelemetry traces, metrics, and logs into one running API.
If you're evaluating whether to use OpenTelemetry or the built-in .NET diagnostics infrastructure for your enterprise workload, I've covered that decision in depth in a separate post: Distributed Tracing in .NET: OpenTelemetry vs Built-in - Enterprise Decision Guide. This guide focuses specifically on how OpenTelemetry works, what its core concepts mean in practice, and how to set it up correctly in an ASP.NET Core application.
What Is OpenTelemetry?
OpenTelemetry (often abbreviated OTel) is an open-source observability framework and a graduated project under the Cloud Native Computing Foundation (CNCF). Its primary goal is simple but powerful: provide a single, vendor-neutral API and SDK that any application can use to emit observability signals - traces, metrics, and logs - to any backend.
Before OpenTelemetry existed, every observability vendor shipped its own SDK. You'd install the Datadog agent, or the New Relic SDK, or the Azure Application Insights SDK, and your code would become tightly coupled to that vendor. Migrating backends meant ripping out the old SDK and adopting a new one. OpenTelemetry solved this by standardising the instrumentation layer. You instrument your code against the OTel API once, and route the data to whichever backend you choose via a swappable exporter.
The Three Pillars of Observability
OpenTelemetry is built around three distinct signal types, commonly called the three pillars of observability:
- Traces - structured records of a request's journey through your system, broken into spans
- Metrics - numeric measurements aggregated over time (request counts, error rates, latency percentiles)
- Logs - timestamped, structured text records of discrete events
Each pillar serves a different purpose and answers different questions. Traces answer where: where did this request go and how long did each step take? Metrics answer how many and how often: how many requests per second are failing? Logs answer what happened: what was the exact error message, and what was the state of the application at that moment?
The OTel Spec, API, and SDK - What's the Difference?
This distinction matters practically. The OTel Specification is the language-agnostic document that defines how signals should be structured, propagated, and exported. It's published by the CNCF and evolves through an open RFC process.
The OTel API is the thin, stable interface your application code calls. It defines things like "start a span" or "record a counter increment." The API is deliberately minimal and safe to take as a dependency - even library authors can reference it without forcing a specific SDK on their consumers.
The OTel SDK is the implementation that actually does the heavy lifting: collecting signals, applying sampling rules, batching data, and sending it to exporters. Your application configures and starts the SDK at startup; after that, the API calls you make in application code are handled by the SDK at runtime.
This separation means you can instrument a shared library against the OTel API, and the consuming application decides whether to include the SDK and how to configure it - a clean separation of concerns.
The Three Pillars Explained
Traces - Following a Request Through Your System
A trace represents the complete lifecycle of a single request as it moves through your system. Think of it as the full story of a single HTTP request that arrives at your API, calls another service, writes to a database, and returns a response. Every step in that journey is recorded as a span.
A span is a named, timed operation. It has a start time, an end time, a status (success or error), and a collection of key-value attributes that describe what happened. Spans form a tree: the initial span that receives the HTTP request becomes the root span, and every downstream operation (a database query, an outbound HTTP call, a background job step) becomes a child span nested beneath it.
The parent-child relationship is what makes distributed tracing powerful. Even when the child span executes in a completely different process on a different server, it still knows which parent span it belongs to. This is achieved through trace context propagation, which we'll cover in detail later.
Baggage is a related concept: a set of key-value pairs that travel alongside the trace context. Unlike span attributes (which are only visible in the span they're attached to), baggage propagates across all downstream services. This makes it useful for carrying tenant IDs, feature flags, or correlation identifiers across your entire system without modifying each service's own data model.
Metrics - Aggregated Numbers Over Time
Metrics are numerical measurements collected over time and aggregated into time series. Unlike logs (which are point-in-time events) or traces (which follow individual requests), metrics are designed for aggregation. You don't store one data point per request - you aggregate thousands of requests into statistical summaries: counts, sums, min/max, and percentile distributions.
OpenTelemetry supports three fundamental metric instrument types:
- Counter - a value that only ever goes up (total requests served, total errors encountered)
- Histogram - records the distribution of values, enabling percentile calculations (P50, P95, P99 latency)
- Gauge - a value that can go up or down and represents a current state (queue depth, active connections, CPU temperature)
Metrics are pulled by systems like Prometheus via an HTTP scrape endpoint your application exposes, or pushed to backends via OTLP. The key difference from logs: metrics are designed to be cheap to store and query at massive scale, because individual data points are aggregated before export.
Logs - Structured Events with Trace Correlation
Structured logging isn't new to .NET developers - ILogger has supported structured logging for years. But OpenTelemetry logs go further by automatically correlating log entries with the active trace context. When a log event is emitted while a span is active, OTel automatically attaches the current TraceId and SpanId to the log record.
This is the key capability that unifies the three pillars. When you see a log error, you can click the TraceId and jump directly to the trace that was executing when the error occurred - giving you the full request context alongside the error message. Without this correlation, logs and traces exist in separate silos and you're left doing manual grep-and-guess debugging.
It's important to understand that OTel logs are not just ILogger. ILogger is Microsoft's logging abstraction. OpenTelemetry provides a bridge that routes ILogger output through the OTel SDK, enriching it with trace context and exporting it via the OTel pipeline. The distinction matters for configuration: you wire ILogger into OTel during setup, and after that your existing ILogger<T> calls automatically benefit from trace correlation.
OpenTelemetry Architecture in .NET
The SDK Layer Cake: API → SDK → Exporter
Understanding the three-layer architecture is essential before you write a single line of configuration. Each layer has a distinct responsibility:
The API layer is what your application code calls. In .NET, this is primarily
System.Diagnostics.ActivitySource(for traces) andSystem.Diagnostics.Metrics.Meter(for metrics). These are built into the .NET runtime itself - you don't even need a NuGet package to produce telemetry signals.The SDK layer is what the OpenTelemetry NuGet packages provide. It picks up the signals produced via the API, applies processing pipelines (sampling, filtering, enrichment), and routes them to exporters. The SDK is registered and configured during application startup.
The Exporter layer translates the SDK's internal data format into a specific protocol and sends it to a backend. Console, OTLP, Prometheus, Jaeger - each of these is a separate exporter package you opt into.
This layered design means the overhead in your hot path is minimal: producing a span or incrementing a counter via the API is a near-zero-cost operation when no SDK is configured. In test environments or when a particular signal is not collected, the API calls are essentially no-ops.
Auto-Instrumentation vs Manual Instrumentation
Auto-instrumentation is provided by the OpenTelemetry community through pre-built instrumentation packages. These packages hook into popular libraries and frameworks - ASP.NET Core, EF Core, HttpClient, gRPC, Redis - and automatically create spans and metrics for operations those libraries perform. You configure them once during startup and they work transparently.
Manual instrumentation is where you add your own spans and metrics for business logic that the auto-instrumentation doesn't know about. You use ActivitySource to create custom spans that represent meaningful operations in your domain: processing an order, validating a voucher, dispatching a notification.
In production applications, you almost always use both. Auto-instrumentation gives you the infrastructure telemetry for free; manual instrumentation gives you the business context that makes the infrastructure telemetry meaningful.
ActivitySource and Activity - .NET's Native Tracing Primitives
One of the most important things to understand about OpenTelemetry in .NET is that the tracing API is not OTel-specific. The .NET runtime has had System.Diagnostics.Activity since .NET Core 2.0, and Microsoft built it to be compatible with the W3C Distributed Tracing standard. OpenTelemetry in .NET simply maps its tracing API to Activity and ActivitySource - these are the same types you'd use for any .NET distributed tracing.
An ActivitySource is a named producer of activities (spans). You create one as a static field, give it a name (typically your service or component name), and use it throughout your code to start new Activity instances. Each Activity represents a span: it has a name, a start time, tags (key-value attributes), events, and a status.
The ActivitySource name is how the OTel SDK knows which activities to collect. During SDK setup, you list the source names you want to subscribe to. Activities from sources that aren't listed are ignored - a clean allow-list mechanism.
Meter and MeterProvider
For metrics, the parallel to ActivitySource is Meter. A Meter is a named factory for metric instruments. You create one statically, then use it to create Counter<T>, Histogram<T>, and ObservableGauge<T> instances. As with tracing, these are standard .NET types from System.Diagnostics.Metrics - they exist independently of OpenTelemetry. The OTel SDK listens to specific Meter names you configure during setup.
The OTel Collector - Optional But Strategically Important
The OpenTelemetry Collector is a standalone service - a proxy/router for telemetry data. Your applications send OTLP data to the Collector, and the Collector fans it out to multiple backends, applies transformations, filters sensitive attributes, and handles retry/buffering logic.
For development and simple deployments, you can export directly from your application to a backend (Jaeger, Prometheus, etc.). But in production environments with multiple services, the Collector becomes important for several reasons:
- Decoupling - your application doesn't need to know about the specific backend. Change backends by reconfiguring the Collector, not the application.
- Attribute filtering - strip PII or sensitive data at the Collector level before it reaches any backend.
- Fan-out - send the same data to multiple backends simultaneously (Grafana Tempo for traces and Azure Monitor for alerting, for example).
- Tail sampling - the Collector can buffer complete traces and apply sampling decisions based on full trace data (not just per-span decisions at ingestion time).
Setting Up OpenTelemetry in ASP.NET Core
Setting up OpenTelemetry in an ASP.NET Core application follows a consistent pattern, regardless of which signals and exporters you're using. The setup happens in Program.cs (or Startup.cs in older templates), and it builds three providers: one for traces, one for metrics, and one for logs.
The entry point is the AddOpenTelemetry() extension method, which is added to the services collection. This method returns a builder that lets you configure each signal independently.
For traces, you call WithTracing() on the builder. Here you set the service name and version (used to identify your service in the backend), add the instrumentation libraries you want to use (ASP.NET Core, EF Core, HttpClient), list the ActivitySource names you want to collect, and configure one or more exporters.
For metrics, you call WithMetrics(). Here you add metric readers (which determine how metrics are collected - pushed at intervals, or pulled via Prometheus scraping), add the Meter names you want to collect, and configure exporters.
For logs, you wire the OTel SDK into the .NET logging pipeline using AddOpenTelemetry() on the ILoggingBuilder. This routes ILogger output through the OTel pipeline, enriching it with trace correlation and exporting it alongside traces and metrics.
The NuGet packages you'll typically need are:
OpenTelemetry.Extensions.Hosting- core hosting integration andAddOpenTelemetry()extensionOpenTelemetry.Instrumentation.AspNetCore- auto-instrumentation for ASP.NET Core HTTP requestsOpenTelemetry.Instrumentation.Http- auto-instrumentation for outboundHttpClientcallsOpenTelemetry.Instrumentation.EntityFrameworkCore- auto-instrumentation for EF Core database queriesOpenTelemetry.Exporter.OpenTelemetryProtocol- OTLP exporter for production useOpenTelemetry.Exporter.Console- console exporter for development and debuggingOpenTelemetry.Exporter.Prometheus.AspNetCore- Prometheus metrics scraping endpoint
The configuration is code-first and straightforward. Each instrumentation library and exporter is added with a single method call on the appropriate builder. The result is a fully configured telemetry pipeline that starts collecting data as soon as the application processes its first request.
Exporters - Where Your Data Goes
An exporter is what takes the data collected by the OTel SDK and sends it somewhere useful. Choosing the right exporter depends on your environment, your existing tooling, and what you're trying to achieve.
Console Exporter
The console exporter writes telemetry data to standard output in a human-readable format. It's not useful in production - the output volume would be overwhelming - but it's invaluable during development. When you're building custom instrumentation and want to confirm that your spans are being created correctly, with the right attributes and the right parent-child relationships, the console exporter gives you immediate feedback without needing any backend running.
OTLP - The Production Standard
OTLP (OpenTelemetry Protocol) is the native wire protocol of OpenTelemetry. It's a protobuf-based protocol that sends all three signal types over gRPC or HTTP/1.1. For production systems, OTLP should be your first choice because it's the lingua franca of the OTel ecosystem - virtually every modern observability backend can receive OTLP.
The ecosystem of OTLP-compatible backends is rich:
- Jaeger - the open-source distributed tracing system, ideal for on-premises deployments
- Grafana Tempo - Grafana's trace storage backend, pairs naturally with Loki (logs) and Prometheus (metrics) in the Grafana observability stack
- Azure Monitor / Application Insights - accepts OTLP via the Azure Monitor Exporter, integrating OTel data into the Azure ecosystem
- AWS X-Ray - via the AWS Distro for OpenTelemetry (ADOT), which wraps the OTel Collector to forward traces to X-Ray
- Honeycomb, Dynatrace, New Relic - all accept OTLP natively and have first-class OTel support
When using the OTel Collector in your architecture, your application always exports OTLP to the Collector, and the Collector handles the fan-out to specific backends. This means your application configuration never changes when you switch backends - only the Collector configuration changes.
Prometheus Exporter
The Prometheus exporter works differently from the others. Instead of pushing data to a backend, it exposes an HTTP scrape endpoint (typically /metrics) that Prometheus pulls from on a configured interval. This pull-based model is the Prometheus-native approach, and it integrates naturally with Grafana dashboards, Prometheus alerting rules, and the broader Prometheus ecosystem.
The Prometheus exporter only handles metrics - traces and logs require a different exporter. In the Grafana stack, you'd typically combine the Prometheus exporter (for metrics) with OTLP to Grafana Tempo (for traces) and OTLP to Grafana Loki (for logs) to get full observability coverage.
Choosing the Right Exporter
| Scenario | Recommended Exporter |
|---|---|
| Local development / debugging | Console |
| Grafana stack (Tempo, Loki, Prometheus) | OTLP + Prometheus (for metrics) |
| Azure-hosted applications | Azure Monitor OTLP Exporter |
| On-premises with Jaeger | OTLP to Jaeger |
| Prometheus-centric infrastructure | Prometheus for metrics + OTLP for traces |
| Multi-backend / complex routing | OTLP to OTel Collector, then fan-out |
Auto-Instrumentation in ASP.NET Core
Auto-instrumentation is one of OpenTelemetry's biggest advantages: you get rich, detailed telemetry from your framework and library dependencies with zero changes to your application logic.
In ASP.NET Core, the ASP.NET Core instrumentation package automatically creates a span for every incoming HTTP request. The span includes the HTTP method, URL, route template, status code, and duration. It also correctly handles context propagation - if the incoming request carries a traceparent header (the W3C Distributed Tracing header), the span is created as a child of the remote parent span, automatically linking the incoming request to the upstream service that initiated it.
The HttpClient instrumentation automatically creates spans for every outbound HTTP call your application makes. Combined with automatic context propagation (OTel injects traceparent headers into outbound requests), this means that the entire chain of service-to-service HTTP calls in your system is automatically linked into a single coherent trace - without you writing any instrumentation code.
EF Core instrumentation creates spans for database queries, including the SQL text (configurable - you can disable SQL capture for security reasons), the database system type, and the duration. This lets you see slow queries in the context of the request that triggered them, rather than having to correlate application-level traces with database-level metrics separately.
gRPC instrumentation (via OpenTelemetry.Instrumentation.GrpcNetClient) works similarly to HTTP, automatically creating spans for gRPC calls and propagating context through gRPC metadata headers.
What doesn't get instrumented automatically? Business logic. If your application processes a payment, validates a coupon, dispatches an email, or runs a complex pricing calculation, those operations are invisible to auto-instrumentation. That's where manual instrumentation with ActivitySource comes in.
You create an ActivitySource for your component, start an Activity when a significant business operation begins, add relevant attributes (order ID, customer tier, payment method), and let it complete when the operation finishes. The OTel SDK takes care of linking it to the correct parent span automatically, using the ambient Activity.Current that propagates through async call chains.
Custom Metrics with System.Diagnostics.Metrics
While auto-instrumentation gives you framework-level metrics (request rates, response times, error counts), business metrics require manual work. System.Diagnostics.Metrics is the .NET API for defining and recording custom metrics.
The starting point is a Meter - a named factory for metric instruments. A Meter is typically created as a static singleton in your application, scoped to a component or service boundary. You give it a name that matches what you configure in the OTel SDK's meter collection.
From a Meter, you create specific instruments:
Counter<T>- for values that only increase. Track total orders processed, total errors encountered, total emails sent. You callAdd()to increment it.Histogram<T>- for recording measurements where distribution matters. Order processing time, database query duration, file upload size. You callRecord()with each individual measurement. The SDK aggregates these into a histogram - the Prometheus or OTLP backend then lets you query P50, P95, P99 percentiles.ObservableGauge<T>- for values that represent a current state and are best measured by polling rather than recording individual events. Active WebSocket connections, current queue depth, in-flight order count. You register a callback that the SDK calls on each collection interval.
Business metrics are enormously valuable for understanding not just system health but business health. An alerting rule that fires when the P99 order processing time exceeds five seconds, or when the queue depth exceeds a configurable threshold, gives your on-call engineer directly actionable information - not just "the CPU is high" but "order processing is degraded and the backlog is growing."
The naming of metrics matters. OpenTelemetry follows a convention of dot-separated hierarchical names in lowercase (for example, orders.processing.duration, orders.total.failed). Using consistent naming conventions across services makes dashboards and alerting rules easier to maintain.
Trace Context Propagation
Trace context propagation is the mechanism that makes distributed tracing distributed. Without it, you'd have isolated spans per service with no way to connect them.
The W3C Distributed Tracing specification defines the traceparent header - a standard HTTP header that carries the current trace ID, the current span ID, and a flags byte. When your ASP.NET Core application receives an HTTP request, the OTel HttpClient instrumentation reads this header and uses it to establish the parent span for all work done processing that request. When your application makes an outbound HTTP call, OTel injects a traceparent header with the current trace ID and the current span ID as the parent. The receiving service then reads that header and continues the same trace.
This is transparent when you're using HTTP - the HttpClient instrumentation handles injection automatically. But it requires deliberate handling in other contexts:
Message queues (RabbitMQ, Azure Service Bus, Amazon SQS): trace context must be serialised into message properties when publishing and deserialised when consuming. The OTel instrumentation libraries for these systems handle this, but you need to use them. If you're using a library without OTel support, you'll need to manually inject and extract context using Propagators.DefaultTextMapPropagator.
Background jobs (Hangfire, Quartz.NET, Worker Services): if a background job is scheduled in response to an HTTP request and should be traced as part of the same user flow, the trace context needs to be captured at scheduling time and restored when the job executes.
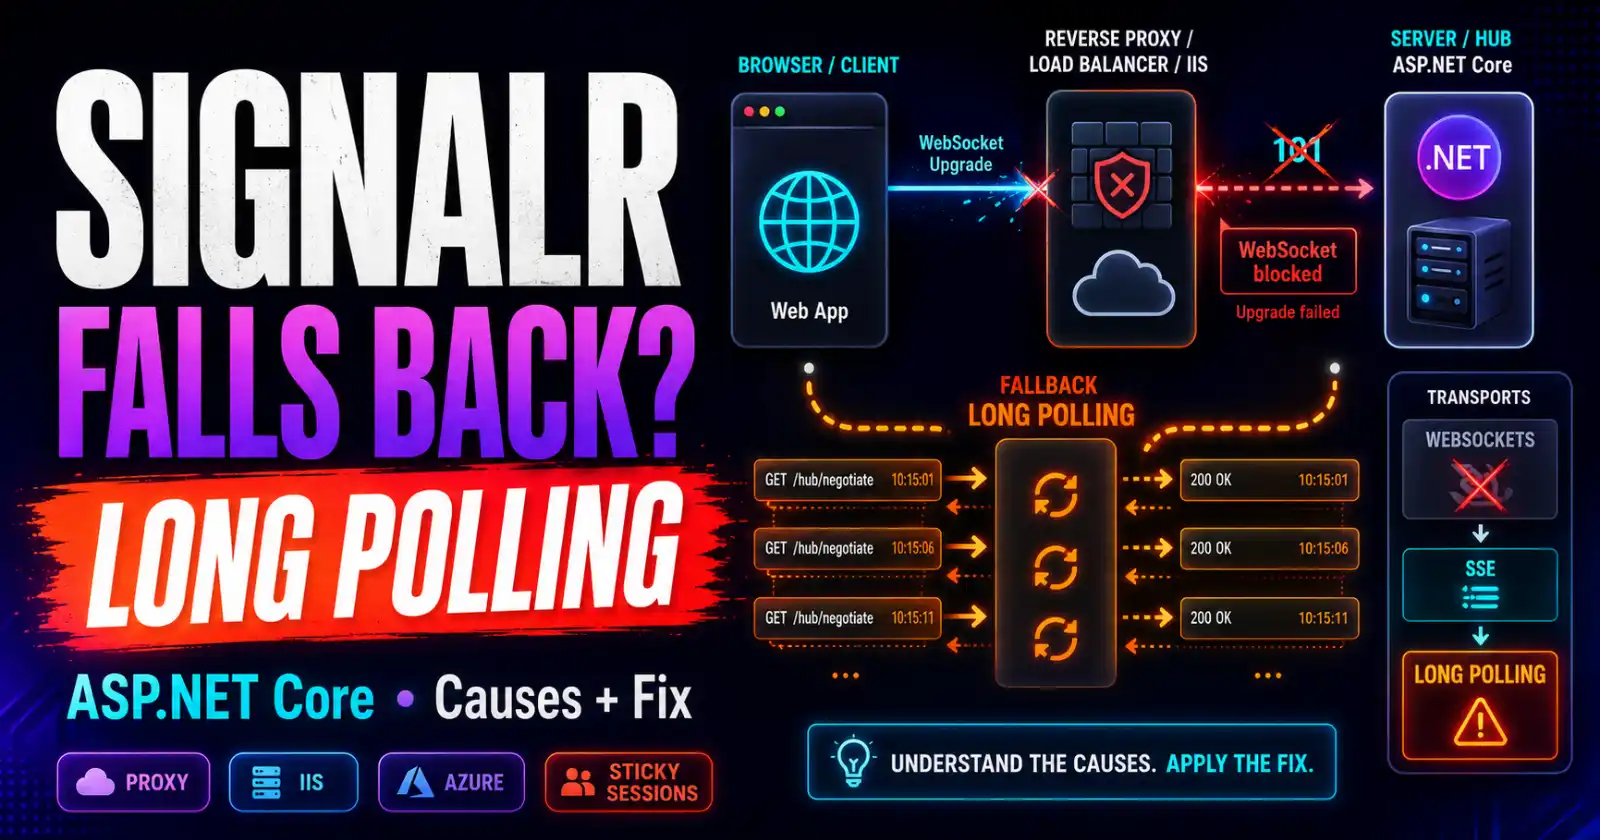
SignalR and WebSockets: context propagation through long-lived connections requires careful handling; the initial handshake can carry context, but mid-connection context changes are more complex.
The TraceId that flows through all of these propagation paths is your single most important debugging tool in a distributed system. When a user reports a problem, you need one identifier that you can use to find every log entry, every database query, every downstream service call that happened during their request - regardless of how many services were involved. That identifier is the TraceId.
Production Considerations
Sampling Strategies
Collecting 100% of traces in a high-traffic system is expensive - both in terms of the CPU and memory overhead in your application, and in terms of storage costs in the backend. Sampling lets you collect a representative subset of traces without losing coverage of errors and outliers.
Head-based sampling makes the sampling decision at the start of a trace, before any spans have been created. It's simple and has the lowest overhead: just generate a random number and compare it to a sampling rate. The downside is that you don't know at the start of a request whether it will be interesting (error, slow, anomalous) - so you may discard exactly the traces you'd want to keep.
Tail-based sampling buffers the complete trace and makes the sampling decision after the trace is complete, when you can see whether it was an error or exceeded a latency threshold. This is far more intelligent but requires the OTel Collector (or another buffering layer) to hold traces in memory until they're complete.
A common production strategy is: 100% sampling for errors and traces exceeding a latency threshold (tail sampling in the Collector), plus a low percentage (1-5%) of all other traces for baseline coverage.
Cardinality Limits
Cardinality refers to the number of unique time series your metrics system needs to track. Each unique combination of metric name plus label values creates a new time series. High cardinality - for example, using a user ID as a metric label - can cause catastrophic storage growth and query performance degradation in Prometheus.
The rule: metric labels should have bounded, low-cardinality values. HTTP status codes (a few hundred possible values), HTTP methods (a handful), endpoint route templates (fixed set per application) - these are safe labels. User IDs, order IDs, session tokens - these are dangerous labels that can create millions of time series. Put high-cardinality identifiers in span attributes (traces), not metric labels.
Performance Overhead
OpenTelemetry's overhead in production is generally low when configured correctly. The main cost centres are:
- Span creation - starting and stopping
Activityobjects has a small but non-zero allocation cost. In extremely hot paths (millions of requests per second), this can be measurable. The SDK's sampling mechanism is your primary mitigation: if a trace is sampled out,ActivitySource.StartActivity()returns null immediately. - Export batching - exporting happens asynchronously in a background thread. The exporter uses a bounded queue; if the exporter can't keep up, it will drop spans rather than blocking the application thread.
- Metric collection - metrics are aggregated in memory before export, which is very efficient. The main risk is cardinality explosion (see above), which can consume large amounts of memory.
A well-configured OTel deployment with appropriate sampling typically adds less than 1-3% overhead to application latency.
Sensitive Data in Attributes
Span attributes are visible to anyone with access to your trace backend - which may include your entire engineering team, contractors, and potentially third-party vendors. Never include: passwords, API keys, payment card numbers, social security numbers, or any data that would be regulated under GDPR, HIPAA, or PCI-DSS.
If you need to correlate traces with users, use an internal identifier (user ID, session ID) rather than email addresses or names. If sensitive data ends up in span attributes due to auto-instrumentation (for example, SQL query text that includes parameter values), configure the instrumentation library to disable that capture, or use the OTel Collector's attribute filtering processor to strip it before the data reaches any backend.
Common Mistakes to Avoid
1. Creating a new ActivitySource per request or per class instance
ActivitySource should be a static singleton scoped to a component or service, not created fresh for each request. Creating thousands of ActivitySource instances per minute wastes resources and, more importantly, prevents the OTel SDK from subscribing to them correctly (the SDK subscribes to source names at startup time).
2. Not disposing Activity objects
Activity implements IDisposable. If you start an Activity and don't dispose it, it will never record an end time, will remain as the ambient Activity.Current, and will potentially leak resources. Always use the Activity in a using statement or ensure Dispose() is called in all code paths, including exception paths.
3. Logging PII or sensitive data in span attributes
Adding attributes like user.email, request.body, or payment.card_number to spans is a common mistake, especially when debugging a production issue. These attributes propagate to every backend the trace is sent to, may be indexed and searchable, and may violate data protection regulations. Establish a team convention: attribute names are reviewed before being merged; PII never goes in spans.
4. Missing context propagation in background jobs
When a background job (Hangfire, Worker Service, hosted service) is triggered as a result of a user request, developers often forget to capture and restore the trace context. The job runs in a fresh thread with no ambient Activity, and the resulting spans appear as a disconnected trace rather than part of the original user request. Capture Activity.Current (or the propagation context) when scheduling the job, and restore it at the start of the job's execution.
5. Using metric labels with unbounded cardinality
As discussed in the Production Considerations section, using high-cardinality values (IDs, free-form strings, user inputs) as metric label values causes cardinality explosion. Common offenders: URL paths with IDs embedded (/orders/12345), which should be templated (/orders/{id}); exception types with full stack trace text; user agents. Always bound your label values.
6. Not setting a resource (service name and version)
Every OTel SDK instance should be configured with a Resource describing the service: name, version, environment, and any other identifying attributes. Without this, traces from your service are attributed to an "unknown service" in the backend, making multi-service queries and dashboards impossible to build correctly. Set the resource during SDK initialization and make it match across all deployments.
Frequently Asked Questions
How does OpenTelemetry compare to Application Insights?
Application Insights is Microsoft's proprietary observability platform for Azure-hosted applications. It has a mature feature set, tight Azure integration, and a managed backend you don't need to operate. OpenTelemetry, by contrast, is vendor-neutral: you're not locked to Azure, and you choose your own backend.
The good news is that these are not mutually exclusive. Microsoft has first-class support for sending OTel data to Application Insights via the Azure Monitor Exporter. You can instrument your code with OTel (vendor-neutral instrumentation) and export to Application Insights (Azure's managed backend). This gives you Azure integration without vendor lock-in in your application code - migrating to a different backend later requires only an exporter change.
Does OpenTelemetry work with .NET Framework?
OpenTelemetry has .NET Framework support, but it's more limited than the .NET (Core) support. The OTel .NET SDK targets netstandard2.0, which .NET Framework 4.6.1+ supports. However, many of the auto-instrumentation packages (ASP.NET Core, HttpClient via HttpClientHandler) are specific to .NET (Core). For .NET Framework applications, you have basic tracing and metrics support, but you may need manual instrumentation for scenarios that auto-instrumentation covers in .NET Core.
If you're maintaining a .NET Framework application, OpenTelemetry is still worthwhile - particularly for getting consistent trace context propagation and a migration path toward .NET as you modernise. But manage expectations: the experience is richer on modern .NET.
Is OpenTelemetry production-ready in 2026?
Yes - OpenTelemetry is a CNCF Graduated project (the highest maturity tier, same tier as Kubernetes and Prometheus). The .NET SDK for tracing and metrics has been stable for several years. The logs signal in the OTel .NET SDK reached stable status in 2023.
As of 2026, OpenTelemetry is the industry standard for open-source observability instrumentation. Companies of all sizes - from startups to large enterprises - run it in production at scale. The ecosystem of compatible backends, collectors, and tooling is mature and actively maintained.
What is the OTel Collector and do I need it?
The OpenTelemetry Collector is an optional but strategically valuable component: a standalone proxy service that receives telemetry from your applications, processes it (filtering, enrichment, sampling), and routes it to backends.
For simple single-service deployments, you don't need it - you can export directly from your application to Jaeger, Prometheus, or another backend. For production systems with multiple services, the Collector becomes valuable because it decouples your applications from specific backends, allows centralised configuration of sampling and filtering, and enables fan-out to multiple backends.
A practical guideline: if you're running three or more services, or if you need tail-based sampling or attribute filtering, add the Collector to your architecture. If you're running a single service with simple requirements, export directly.
How do I correlate logs with traces?
Correlation works through the ambient trace context. When your application is handling a traced request, Activity.Current holds the active span. The OTel logging integration automatically reads Activity.Current and attaches the current TraceId and SpanId to every log entry emitted while that span is active.
In your log backend (Grafana Loki, Elasticsearch, Azure Monitor Logs), you'll see TraceId and SpanId as structured fields on each log entry. From your trace in the trace backend (Jaeger, Grafana Tempo), you can jump to logs for the same TraceId to see the log entries that occurred during that specific request. Both Grafana and Azure Monitor support this correlation natively.
The key prerequisite is that logs and traces must be sent to backends that support cross-signal querying. Grafana's stack (Tempo + Loki + Prometheus) is designed specifically for this. Azure Monitor supports it through Application Insights' integrated experience.
What is the performance overhead of OpenTelemetry in production?
With appropriate configuration, OTel's overhead is typically less than 1-3% of application latency for request-handling scenarios. The main controllable factors are:
- Sampling rate - sampling down to 10% or 1% of traces dramatically reduces overhead while maintaining observability of errors (which you should sample at 100%)
- Export frequency and batching - exporting happens asynchronously, so it doesn't block request handling. Tune the batch size and export interval to balance latency and overhead.
- Cardinality - keep metric label cardinality low. Cardinality explosion increases memory consumption, not just latency.
- Attribute verbosity - adding many large-string attributes to spans increases serialisation cost. Be selective about what you capture.
For the vast majority of .NET applications, OTel's overhead is negligible compared to the value of the observability data it provides. The largest overhead risk is misconfiguration (extremely high sampling rates with no batching, or cardinality explosion) rather than the OTel SDK itself.
About the Author
Celin Daniel is Co-founder of Coding Droplets with 13+ years of hands-on experience building, shipping, and operating .NET and ASP.NET Core systems in production. The guidance here comes from real projects and production incidents, not theory.
- Website: codingdroplets.com
- GitHub: github.com/codingdroplets
- YouTube: youtube.com/@CodingDroplets