
ASP.NET Core Intermittent Latency Spikes in Production: GC Pressure, ThreadPool Starvation, and Connection Pool Root Causes and Fixes
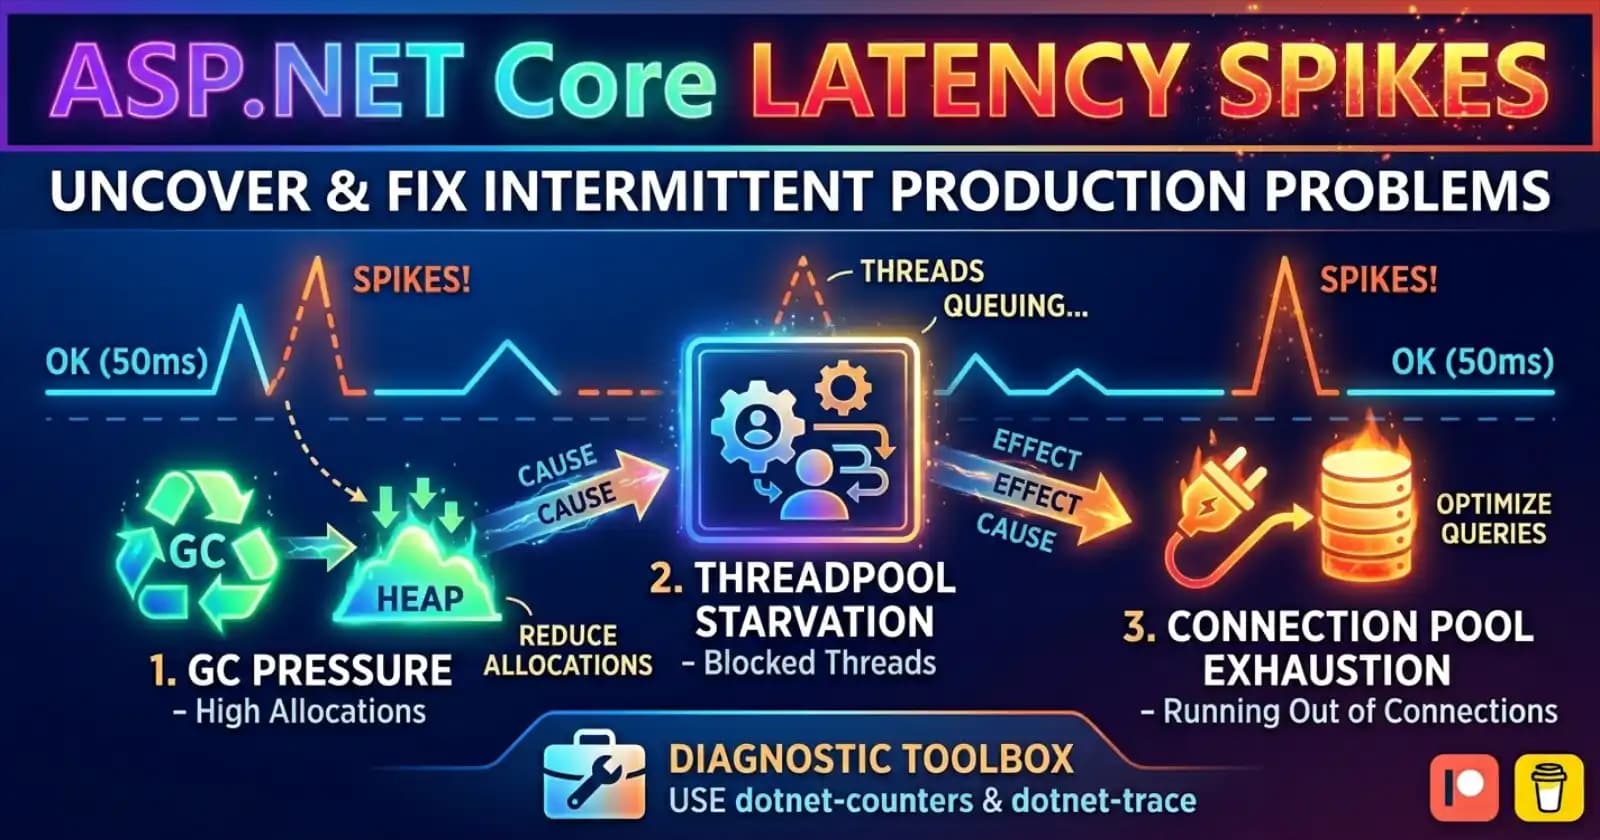
Intermittent latency spikes are one of the most deceptive production problems in ASP.NET Core. The API runs fine under low load, all your unit tests pass, and local benchmarks look healthy - then under real production traffic, requests that normally complete in under 50ms suddenly start hitting 2 - 5 seconds, seemingly at random, before recovering on their own. Logs show nothing obvious. No exceptions. No errors. Just elevated p99 response times that nobody can explain. If you have encountered this pattern, the root cause is almost always one of three things: garbage collector pressure, ThreadPool starvation, or connection pool exhaustion - and often a combination of all three. The full annotated diagnostic scripts and configuration patterns that go with this article are available on Patreon, with worked examples against a real production-scale load test.
Understanding ASP.NET Core latency spikes in production means understanding how the runtime manages memory, threads, and I/O concurrency at the same time. These three systems interact in ways that are not always obvious from application code. A GC pause that blocks threads for 80ms can cascade into ThreadPool starvation. An overloaded connection pool creates a queue of waiting requests that all time out together, then recover together - which looks like a spike when it is actually a backlog. Getting to the root cause requires knowing how to observe each layer independently before concluding which one is responsible.
Why Intermittent Spikes Are So Hard to Diagnose
The word "intermittent" is the key signal. Deterministic bugs produce deterministic symptoms. Intermittent spikes mean the problem is load-dependent, resource-dependent, or timing-dependent - it only appears when specific conditions align. The three main culprits behave this way by design:
- GC pressure appears when allocation rates exceed what the background GC can keep up with, triggering blocking Gen 2 or LOH compaction events
- ThreadPool starvation appears when all available threads are blocked waiting on I/O or synchronous operations, forcing new requests to queue until a thread becomes free
- Connection pool exhaustion appears when all database connections in the pool are held by in-flight queries, causing new requests to wait for a connection lease
Each of these creates a distinctive spike profile, and each has a different diagnosis path.
Root Cause 1: Garbage Collector Pressure
The .NET GC is designed to run in the background without stopping application threads. For most workloads it does exactly that. But when allocation rates are high - particularly allocations of objects that survive into Gen 2, or allocations of large objects (greater than 85,000 bytes by default) that go directly to the Large Object Heap - the GC must perform a compacting collection that briefly stops all threads. These stop-the-world pauses typically last anywhere from 10ms to 300ms depending on heap size and fragmentation.
The practical causes of GC pressure in ASP.NET Core APIs include:
String allocations in hot paths. Serialisation, log interpolation, and query string building that runs on every request creates short-lived allocations that age into Gen 1 and Gen 2 faster than expected under load.
Large response buffers. Returning large JSON payloads or loading bulk data into memory in a single call puts objects directly onto the LOH. An 86KB+ array created per request at 500 req/s is a significant LOH pressure source.
LINQ materialisation on every request. Calling .ToList() on large result sets, re-projecting collections, or not using streaming enumerables forces collections to be fully allocated in memory on every request.
Diagnostic approach: Use dotnet-counters to observe GC pause frequency and Gen 2 collection rate in real time:
dotnet-counters monitor --process-id <pid> System.Runtime
Watch for gc-heap-size, gen-2-gc-count, loh-size, and time-in-gc. A time-in-gc above 10% under load is a clear signal of GC pressure causing latency impact.
Fix strategy: Reduce allocation on hot paths. Use ArrayPool<T> and MemoryPool<T> for buffer reuse. Replace string concatenation in loops with StringBuilder or interpolated strings with ReadOnlySpan<char>. Use IAsyncEnumerable<T> for large result sets instead of materialising everything with .ToList(). For JSON serialisation in high-throughput scenarios, System.Text.Json with source generation eliminates much of the per-request allocator pressure.
Root Cause 2: ThreadPool Starvation
The ASP.NET Core Kestrel server processes each request on a ThreadPool thread. The ThreadPool starts with a small number of threads and grows dynamically - but growth is gated by a hill-climbing algorithm that adds one thread per second when it detects contention. Under a sudden traffic spike, this growth rate is far too slow. If existing threads are blocked waiting on synchronous I/O or .Result/.Wait() calls on Tasks, incoming requests queue behind them and start breaching SLA thresholds before the ThreadPool can compensate.
We covered ThreadPool starvation in detail in a dedicated article - but the short version is that two patterns cause almost all starvation cases:
- Calling
.Resultor.Wait()on async code - common in legacy middleware, startup code that was "quickly made synchronous," or third-party libraries - Sync-over-async in database access - using synchronous EF Core or ADO.NET methods (
Find(id)instead ofFindAsync(id),SaveChanges()instead ofSaveChangesAsync())
Diagnostic approach: dotnet-counters again:
dotnet-counters monitor --process-id <pid> System.Runtime --counters threadpool-queue-length,threadpool-thread-count
If threadpool-queue-length spikes to dozens or hundreds during a latency event while threadpool-thread-count grows slowly, you have starvation. You can also use dotnet-trace to capture a trace during a spike and analyse it with PerfView or SpeedScope to identify exactly which call stacks are blocking threads.
Fix strategy: Audit every synchronous blocking call in the request pipeline. Replace .Result with await. Replace .Wait() with await. Replace synchronous EF Core methods with their async counterparts. For startup code that must run synchronous operations, ensure it runs before app.Run() and not inside middleware handlers. Where a third-party library forces synchronous execution, consider offloading to a dedicated TaskCreationOptions.LongRunning thread rather than using a ThreadPool thread.
Root Cause 3: Database Connection Pool Exhaustion
EF Core and ADO.NET maintain a connection pool - by default a maximum of 100 connections for SQL Server. When all 100 connections are in use, new requests that need a database connection must wait in a queue. If the wait exceeds the connection timeout (default: 15 seconds for SQL Server), the request throws a SqlException with the message "Timeout expired. The timeout period elapsed prior to obtaining a connection from the pool." If it does not exceed the timeout, the request simply spends its entire latency budget waiting for a connection to become free - which is what creates the spike.
We covered this root cause in detail in EF Core Connection Pool Exhaustion in ASP.NET Core. The common triggers are:
- Long-running queries holding connections. Connections are only returned to the pool once the query is complete and the
DbContextis disposed. A slow query that takes 3 seconds holds a connection for 3 seconds - at 50 concurrent slow requests, the pool is saturated. DbContextnot disposed promptly. In non-DI scenarios or manualDbContextinstantiation, connections can be held far beyond their useful lifetime.- N+1 query patterns. Loading a parent entity then querying children one at a time in a loop multiplies the connection hold time per request, saturating the pool faster than expected.
- Missing
AsNoTracking()on read queries. EF Core tracking overhead keeps contexts alive longer than necessary in scenarios where writes never happen. - Too many concurrent operations per request. Parallelising
DbContextoperations (e.g.,Task.WhenAllwith multiple queries) on the same context instance causes errors; spreading them across multiple contexts simultaneously exhausts the pool.
Diagnostic approach: Monitor the Microsoft.EntityFrameworkCore.Database.Connection category with structured logging enabled at Information level, or instrument your application with OpenTelemetry to track active connection counts. In SQL Server, the DMV sys.dm_exec_requests shows active connections and their wait states. Azure SQL provides this through Query Performance Insight.
Fix strategy: Increase awareness of query duration in hot paths. Add AsNoTracking() on all read-only queries. Resolve N+1 patterns with .Include() or split queries. Review your Max Pool Size connection string setting - increasing from 100 to 200 - 300 is often appropriate for high-traffic APIs, but treat this as a palliative measure, not a fix. The real fix is shortening query duration and reducing unnecessary holds.
How the Three Root Causes Interact
What makes production latency spikes particularly difficult to diagnose is that these three causes interact. A GC pause that blocks all threads for 50ms causes incoming requests to queue. If those queued requests all proceed simultaneously once threads are released, they saturate the connection pool together. The connection pool exhaustion then holds the connections long enough that threads block waiting for results, which contributes to a secondary ThreadPool pressure event. The result is a cascade - a short GC pause triggers a spike that looks far worse than the GC event itself would suggest.
This is why diagnosing with a single metric is unreliable. Observing all three - GC pause frequency, ThreadPool queue depth, and active database connection count - simultaneously during a latency event gives you a causal chain to work from. dotnet-counters and dotnet-trace provide exactly this visibility without requiring application restarts or code changes.
A Diagnostic Playbook for Production Latency Spikes
When a latency spike event is in progress or has just occurred:
Step 1 - Confirm the scope. Check your APM dashboard (Application Insights, Datadog, Grafana + OpenTelemetry) for which endpoints are affected. A spike isolated to one endpoint strongly suggests a specific slow query or blocking call. A spike across all endpoints suggests a runtime-level cause (GC or ThreadPool).
Step 2 - Check GC metrics. If you have live metrics available, look at time-in-gc and gen-2-gc-count. A spike in Gen 2 collections coinciding with the latency event confirms GC pressure. Run dotnet-counters against the live process if metrics are not already instrumented.
Step 3 - Check ThreadPool metrics. Look at threadpool-queue-length. A queue length that spikes significantly during the latency window - with slow thread count growth - confirms starvation. Look for synchronous blocking call stacks in a dotnet-trace capture.
Step 4 - Check database connection metrics. Query sys.dm_exec_requests or your equivalent. Look for a large number of requests in WAITFOR or SLEEP states, or requests that have been active for many seconds. Enable EF Core connection logging at Debug level temporarily if you need per-query visibility.
Step 5 - Cross-correlate timing. Map the timestamps of each signal against the p99 response time timeline. Whichever signal appears first is the triggering cause. The others may be downstream effects.
Prevention: Reducing Spike Frequency at the Source
Beyond diagnostics, three architectural decisions significantly reduce the frequency and severity of latency spikes:
Server GC over Workstation GC. Container deployments that do not explicitly configure GC mode can default to Workstation GC, which uses fewer threads and pauses more frequently. Set System.GC.Server=true in runtimeconfig.json for production ASP.NET Core workloads. Alternatively, set the environment variable DOTNET_GCConserveMemory to tune memory vs latency trade-offs.
Minimum ThreadPool threads. The ThreadPool default minimum for many environments is set to the number of logical processors. Under burst traffic, this is too low. Use ThreadPool.SetMinThreads(workerThreads, completionPortThreads) at startup to pre-warm enough threads to absorb an initial burst without triggering the slow hill-climbing growth delay. Be conservative - excessively high minimums waste memory.
Connection pool sizing matched to workload. Profile your average query duration under load. Multiply expected concurrency by average query duration in seconds to estimate your target pool size. Add a safety margin. Set Max Pool Size in your connection string accordingly - but pair it with query performance work rather than relying solely on a larger pool.
What Should Not Be Your Diagnostic Tool
A few approaches that are commonly tried but are poor diagnostic choices:
Restarting the process. A restart clears the symptom temporarily but tells you nothing about the cause, and risks data integrity if connections are mid-transaction.
Adding more replicas without diagnosis. Horizontal scaling can reduce per-instance load but does not fix a structural issue. GC pressure from large allocations will affect every replica. ThreadPool starvation from synchronous code will affect every replica. More instances of a broken design is still a broken design.
Increasing timeouts. Raising connection timeout, command timeout, or Kestrel request timeout delays failure but does not prevent queuing. It often makes spikes worse by holding resources longer before releasing them.
FAQ
What is the most common cause of intermittent latency spikes in ASP.NET Core production APIs?
The most common single cause is ThreadPool starvation from synchronous blocking calls - typically .Result, .Wait(), or synchronous EF Core operations used in code paths that run under real concurrent load. This is common in APIs that were progressively async-ified from a synchronous codebase and still contain legacy synchronous sections in middleware or service layers. GC pressure from large or frequent allocations is the second most common cause.
How do I know if my ASP.NET Core latency spikes are caused by GC or something else?
The clearest signal is correlation between gen-2-gc-count and time-in-gc metrics and the timestamps of your latency events. If the GC pause duration and frequency spike at exactly the same time as your p99 latency rises, GC is the cause. Use dotnet-counters to observe these metrics live. If the GC metrics look healthy during a latency event, shift your investigation to ThreadPool queue depth and connection pool wait times.
Can GC pauses really cause noticeable latency spikes in production?
Yes. In APIs with high allocation rates or significant LOH usage, stop-the-world Gen 2 collections can pause all threads for 50 - 300ms depending on heap size. At p99, this is highly visible. The effect is amplified when concurrent requests are queued during the pause and then all proceed simultaneously when threads resume - creating a burst that itself strains the ThreadPool and connection pool.
What is the recommended way to diagnose a live ASP.NET Core production latency spike?
Use dotnet-counters to monitor key runtime counters live against the process - specifically threadpool-queue-length, gen-2-gc-count, time-in-gc, and loh-size. If the spike is reproducible, capture a dotnet-trace during the event and analyse it in PerfView or SpeedScope to identify the blocking call stacks. For database-related spikes, query your database engine's active request DMVs or query the activity log from your APM tool. Microsoft's .NET diagnostics documentation provides the full reference for these tools.
How does the dotnet-trace tool help identify latency root causes?
dotnet-trace captures a continuous trace of .NET runtime events - including GC events, ThreadPool events, and method-level timing - with very low overhead. After a spike, you can load the trace file in PerfView and look at the Flame Graph view to identify which methods are spending the most time executing or waiting. Call stacks that show .Result or .Wait() at the top of blocked thread stacks are the classic ThreadPool starvation signature. Concentrated Gen 2 GC events clustered around the spike timestamp confirm GC pressure.
How many database connections should my ASP.NET Core API pool have configured?
The right pool size depends on your query duration and concurrency profile. A rough formula: Max Pool Size = (average concurrent requests) × (average query duration in seconds) × safety_factor(1.5). For most production APIs serving a few hundred concurrent users with sub-100ms queries, the default of 100 is adequate if queries are written efficiently. If you are regularly saturating the pool, start by optimising slow queries and adding AsNoTracking() to read-only paths before increasing Max Pool Size.
Is it worth increasing the minimum ThreadPool threads in production?
Yes, for APIs that experience burst traffic. Pre-warming threads with ThreadPool.SetMinThreads() at startup avoids the slow hill-climbing growth delay when traffic spikes. A reasonable starting point is setting the minimum to the number of logical processors multiplied by 4 - 8, then measuring the impact on burst-traffic p99 latency. This does not fix starvation caused by synchronous blocking code - it only reduces the ramp-up delay when load increases suddenly.
About the Author
Celin Daniel is Co-founder of Coding Droplets with 13+ years of hands-on experience building, shipping, and operating .NET and ASP.NET Core systems in production. The guidance here comes from real projects and production incidents, not theory.
- Website: codingdroplets.com
- GitHub: github.com/codingdroplets
- YouTube: youtube.com/@CodingDroplets